How Dubai grew, 1986 to today
One satellite picture a year shows the city spreading from the Creek into the desert and the sea. From 2008 the film counts the homes finished each year, apartments and villas apart, and names the areas as they take off.
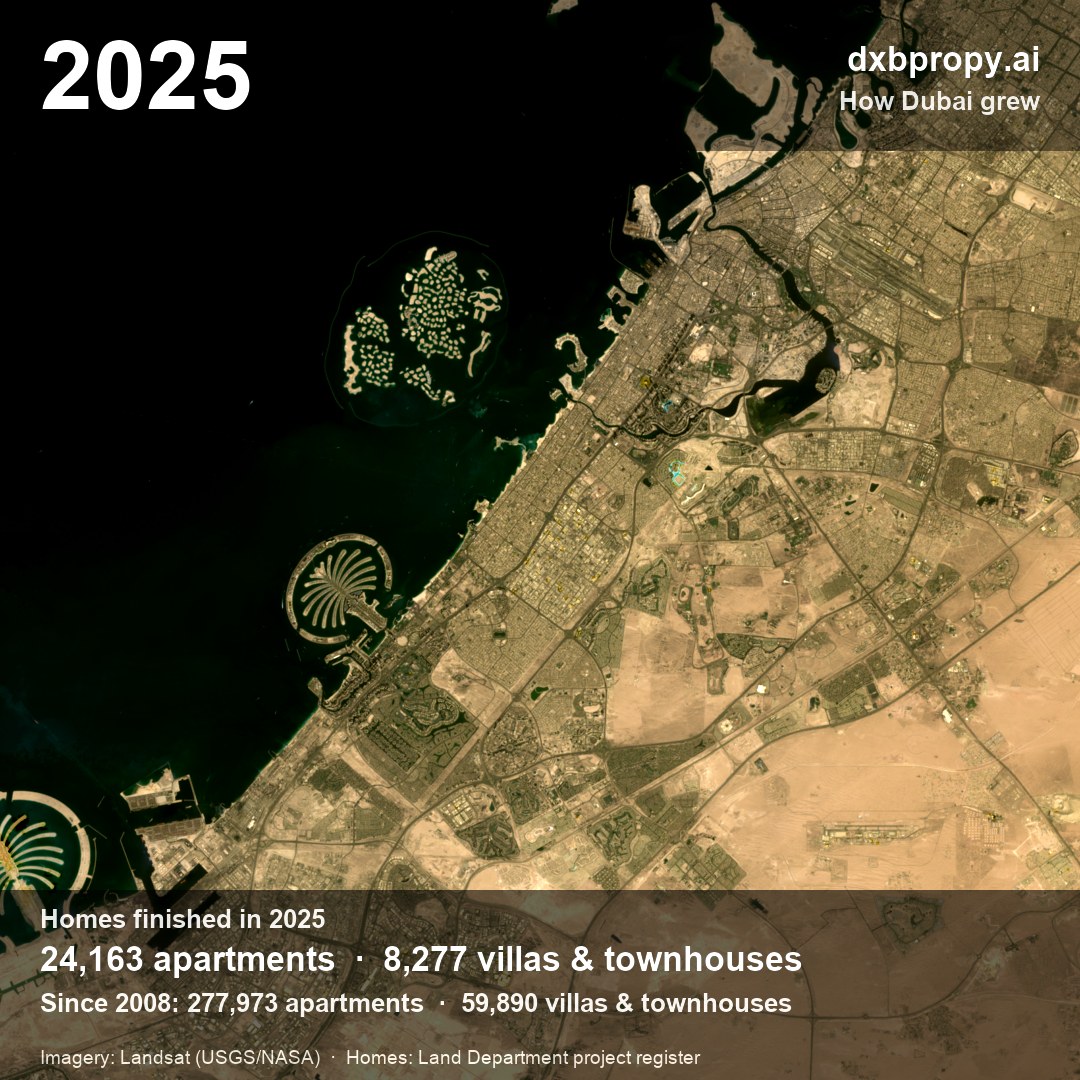
Imagery: Landsat (USGS/NASA), via Microsoft Planetary Computer. Homes: Land Department project register.
Homes finished by area
Every area with at least 200 homes in the register, biggest first. Apartments and villas / townhouses are counted apart.
| Area | Apartments finished | Villas & townhouses finished | First year | Busiest year | Apartments due | Villas & townhouses due |
|---|---|---|---|---|---|---|
| Jumeirah Village Circle | 36,383 | 1,046 | 2010 | 2024 | 32,356 | 68 |
| Business Bay | 27,861 | — | 2009 | 2024 | 21,336 | — |
| Dubai Marina | 17,856 | — | 2005 | 2010 | 3,808 | — |
| Downtown Dubai | 15,911 | — | 2008 | 2022 | 4,542 | — |
| Dubai Sports City | 13,118 | 372 | 2009 | 2014 | 7,704 | — |
| Dubai Hills Estate | 10,097 | 3,257 | 2018 | 2022 | 8,204 | 33 |
| Dubai Creek Harbour | 11,966 | — | 2019 | 2022 | 7,359 | — |
| Arjan | 11,140 | — | 2011 | 2024 | 8,998 | — |
| Jumeirah Lake Towers (JLT) | 11,026 | — | 2007 | 2008 | 9,575 | 1 |
| Silicon Oasis | 10,653 | — | 2009 | 2009 | 3,503 | — |
| DAMAC Hills 2 | 701 | 9,637 | 2019 | 2022 | 1,802 | 3,530 |
| Town Square | 6,616 | 3,478 | 2018 | 2019 | 4,681 | — |
| Me'aisem First | 8,865 | 817 | 2008 | 2014 | 8,008 | 1,205 |
| Al Furjan | 6,765 | 2,250 | 2013 | 2024 | 3,886 | 15 |
| Sobha Hartland | 8,583 | 106 | 2018 | 2023 | 1,684 | 1 |
| Dubai Production City | 8,117 | — | 2008 | 2014 | 8,008 | — |
| DAMAC Hills | 5,064 | 2,786 | 2016 | 2022 | 2,927 | 201 |
| Palm Jumeirah | 7,401 | 109 | 2009 | 2009 | 2,459 | 38 |
| Dubai South | 5,021 | 2,266 | 2016 | 2020 | 31,764 | 4,729 |
| Dubai Residence Complex | 7,029 | — | 2009 | 2011 | 22,446 | — |
| Al Jaddaf | 5,901 | — | 2015 | 2022 | 6,650 | — |
| Dubai Lifestyle City | 766 | 4,922 | 2009 | 2022 | 750 | 2,952 |
| Jumeirah Village Triangle | 5,292 | 8 | 2013 | 2026 | 10,832 | 3 |
| Wadi Al Safa 2 | 5,041 | 51 | 2009 | 2014 | 3,932 | 653 |
| Remraam | 4,905 | — | 2013 | 2013 | — | — |
| The Springs | — | 4,856 | 2004 | 2004 | — | — |
| Wadi Al Safa 3 | 2,479 | 2,300 | 2013 | 2023 | 16,605 | 2,391 |
| Mudon | 181 | 4,154 | 2015 | 2026 | — | — |
| Arabian Ranches 3 | — | 4,221 | 2022 | 2022 | — | — |
| Emaar Beachfront | 3,863 | — | 2021 | 2023 | 2,011 | — |
| Al Wasl | 3,437 | — | 2016 | 2024 | 4,341 | — |
| DAMAC Lagoons | — | 3,122 | 2025 | 2025 | 6,275 | 5,689 |
| Villanova | — | 3,117 | 2020 | 2022 | — | 850 |
| City Walk | 2,681 | — | 2016 | 2017 | 1,904 | — |
| MBR City District 1 | 1,752 | 856 | 2020 | 2023 | 456 | — |
| Nad Al Sheba | 1,677 | 907 | 2016 | 2017 | 6,594 | 1,890 |
| Dubai Studio City | 2,530 | 2 | 2014 | 2025 | 2,140 | — |
| The Valley | — | 2,354 | 2023 | 2025 | 1,264 | 7,821 |
| Tilal Al Ghaf | — | 2,213 | 2023 | 2024 | — | 366 |
| DIFC | 1,987 | 3 | 2009 | 2022 | 2,360 | — |
| Rukan | 766 | 1,139 | 2022 | 2022 | — | — |
| Emaar South | 932 | 820 | 2020 | 2020 | 590 | 1,244 |
| MBR District 11 (Meydan South) | 279 | 1,466 | 2021 | 2023 | 1,052 | 611 |
| Majan | 1,738 | 1 | 2013 | 2025 | 12,049 | — |
| Jumeirah Golf Estates | 748 | 817 | 2010 | 2019 | — | 1,205 |
| Serena | — | 1,531 | 2019 | 2020 | — | — |
| Al Kifaf | 1,500 | — | 2020 | 2022 | 2,406 | — |
| Jabal Ali Industrial 2 | 1,485 | — | 2013 | 2020 | 4,620 | — |
| JBR | 1,182 | — | 2020 | 2023 | 271 | — |
| Mirdif | 1,156 | — | 2016 | 2020 | 193 | — |
| Jumeirah Islands | 1,097 | — | 2012 | 2012 | 4,146 | — |
| Wasl Gate | 596 | 303 | 2020 | 2022 | 5,907 | — |
| Jumeirah Park | — | 880 | 2015 | 2016 | — | — |
| City of Arabia | 856 | — | 2020 | 2026 | 11,423 | — |
| Barsha Heights | 829 | — | 2009 | 2009 | 117 | — |
| Bluewaters Island | 719 | — | 2019 | 2019 | — | — |
| Al Barari | 462 | 247 | 2020 | 2022 | 1,026 | 941 |
| The Lakes | — | 675 | 2003 | 2006 | — | — |
| Motor City | 542 | 95 | 2017 | 2019 | 12,170 | — |
| Emirates Hills | — | 624 | 2000 | 2000 | — | — |
| Al Satwa | 551 | — | 2025 | 2025 | 4,217 | — |
| Al Safouh First | 363 | 55 | 2013 | 2014 | 355 | — |
| Mina Rashid | 412 | — | 2025 | 2025 | 4,781 | — |
| Saih Shuaib | 170 | 235 | 2011 | 2020 | 2,171 | 131 |
| Arabian Ranches II | — | 385 | 2014 | 2014 | — | — |
| Dubai Maritime City | 381 | — | 2021 | 2021 | 12,033 | — |
| The Sustainable City | — | 319 | 2017 | 2017 | — | — |
| The Greens | 277 | — | — | — | — | — |
| Jumeira Bay | 181 | 92 | 2017 | 2017 | 31 | — |
| Dubai Islands | 269 | — | 2025 | 2026 | 14,032 | 993 |
| Za'abeel 1 | 263 | — | 2023 | 2023 | 1,748 | — |
| Trade Center First | 248 | — | 2011 | 2011 | 1,931 | — |
| Arabian Ranches - 1 | — | 229 | 2008 | 2013 | — | — |
| DIP | 226 | — | 2018 | 2018 | 3,459 | 1,995 |
Source: Land Department project register. It covers projects registered since about 2008, so buildings finished earlier are not counted. Homes = residential units only; shops, offices and hotel units are left out.