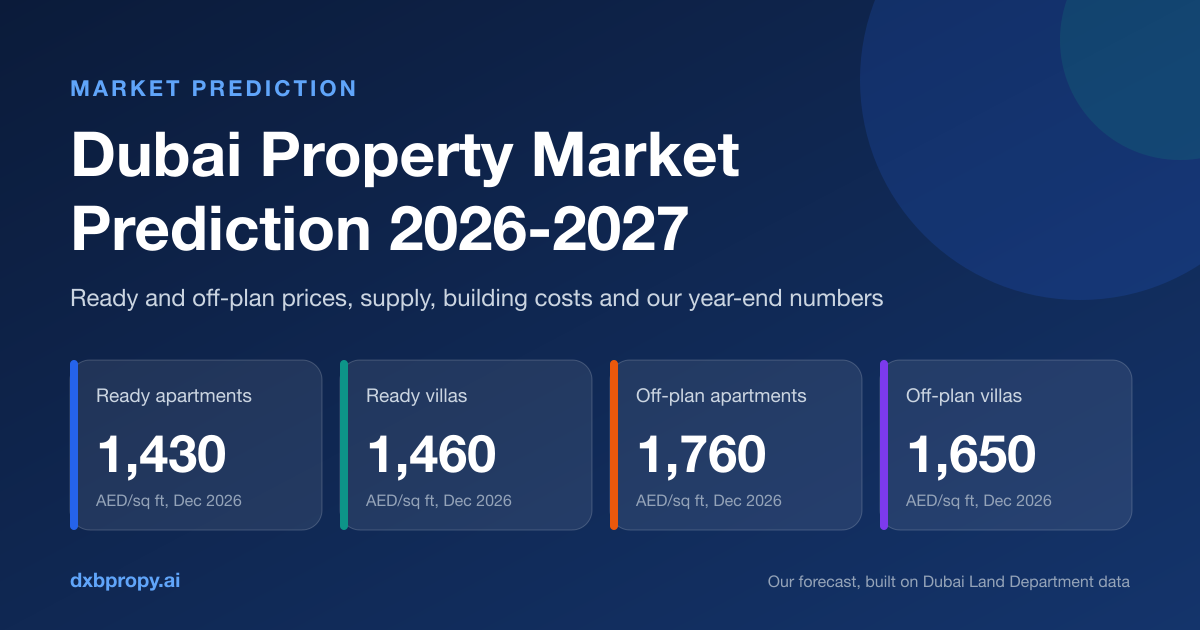
Our call for the rest of 2026 is a steady market, not a falling one. We expect the typical ready apartment to close December at about AED 1,430/sqft (AED 15,392/m²), the typical ready villa at about AED 1,460/sqft (AED 15,715/m²), the typical off-plan apartment at about AED 1,760/sqft (AED 18,944/m²), and the typical off-plan villa at about AED 1,650/sqft (AED 17,760/m²). For 2027 our base case is a small rise for ready homes (+2% apartments, +4% villas) and a larger one for off-plan prices in the same communities (+5% apartments, +3% villas), because building costs are up 10.8% in a year. Below is the data behind every number.
Our prediction in numbers
These are typical prices: the median AED per sq ft of registered Dubai Land Department sales. The median is the middle sale, so a few trophy deals cannot pull it up or down. Ready and off-plan are never mixed, and apartments and villas are kept apart.
| Typical AED/sqft | Now (Jun to early Oct 2026) | Dec 2026 forecast | Dec 2026 range | Dec 2027 base case | Dec 2027 bear to bull |
|---|---|---|---|---|---|
| Ready apartments | 1,407 | 1,430 | 1,380 to 1,480 | 1,459 (+2%) | 1,344 to 1,516 |
| Ready villas | 1,444 | 1,460 | 1,400 to 1,530 | 1,518 (+4%) | 1,402 to 1,577 |
| Off-plan apartments | 1,742 | 1,760 | 1,690 to 1,850 | 1,848 (+5%) | 1,672 to 1,918 |
| Off-plan villas | 1,640 | 1,650 | 1,520 to 1,800 | 1,700 (+3%) | 1,551 to 1,782 |
In AED per m² the four December 2026 forecasts are AED 15,390, AED 15,720, AED 18,950 and AED 17,760 (1 m² = 10.7639 sq ft). For villas the registry measures the plot, so villa prices per sq ft are best compared with other villa prices, not with apartments. Off-plan villas have the widest range, because few projects sell at a time (1,594 sales since June) and the median follows which projects those are.
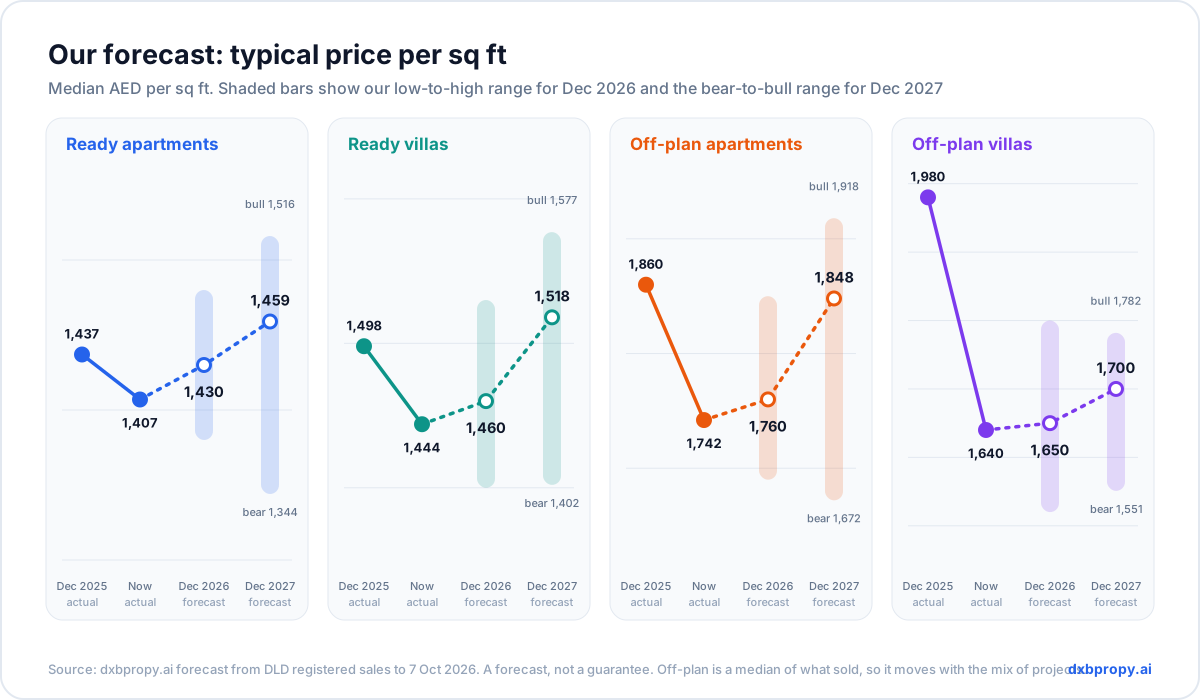
Our weights for 2027 are 55% base case, 25% bear case and 20% bull case. They are our judgement, not a statistical output. The bear case is a second shock on top of the heavy 2027 handover wave. The bull case is a settled region and returning investor flows.
What happened to prices: before the conflict, during it, and since
The regional conflict began on 28 February 2026, when the United States and Israel attacked Iran and Tehran struck Israel and Gulf states that host US forces, the UAE among them. The situation is not fully settled: a Pakistan-brokered peace deal is in place and shipping through the Strait of Hormuz is still in the news. Our earlier article, The Iran conflict shook Dubai property, covers the first months. Here is the full picture up to 7 October 2026, from the registered apartment and villa sales:
| Typical AED/sqft | Before: Dec to Feb | Conflict quarter: Mar to May | Since: Jun to early Oct | Before to since | Since vs same months 2025 |
|---|---|---|---|---|---|
| Ready apartments | 1,468 | 1,417 | 1,407 | −4.2% | +3.8% |
| Ready villas | 1,497 | 1,495 | 1,444 | −3.5% | +2.4% |
| Off-plan apartments | 1,860 | 1,820 | 1,742 | −6.3% | −6.9% |
| Off-plan villas | 1,822 | 1,822 | 1,640 | −10.0% | +12.8% |
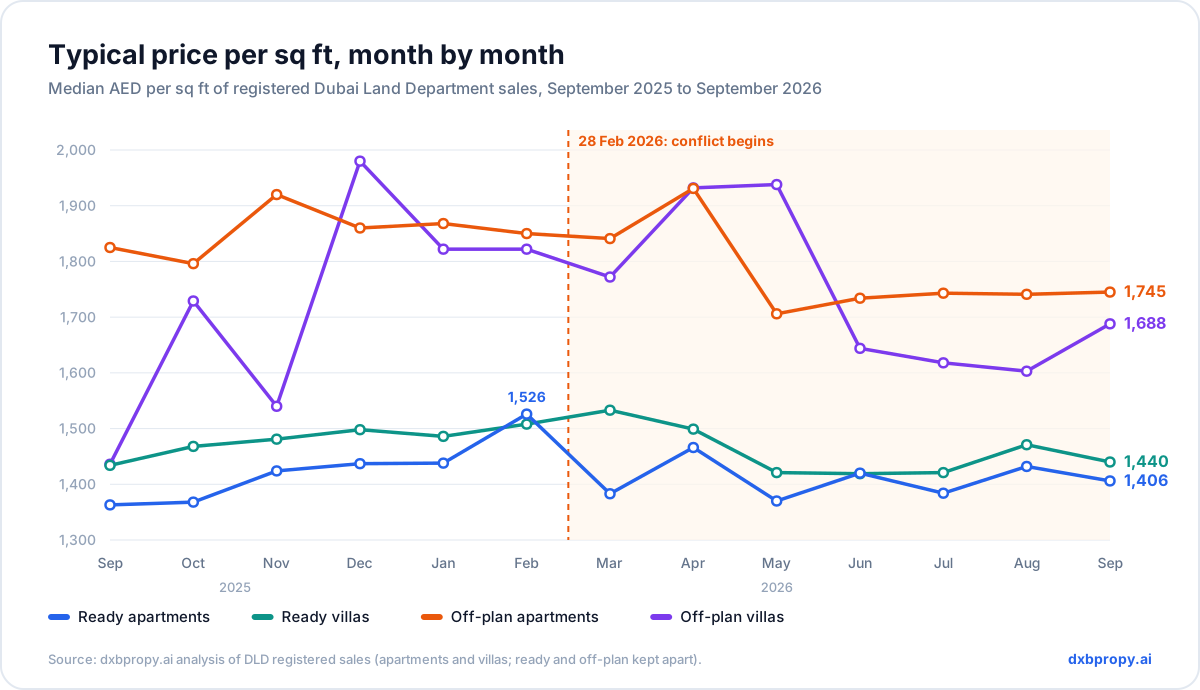
Two things stand out. First, ready prices dipped about 3 to 4% and have stayed flat since May. They did not slide. February 2026 was an unusually strong month for ready apartments (AED 1,526/sqft (AED 16,426/m²)), which makes "before" look high. Second, the off-plan drop is a change in what was sold, not a change in price. The typical off-plan apartment ticket fell from AED 1.40M to AED 1.06M (−24%) because buyers moved to smaller flats in newer, cheaper areas. When we compare the same communities with themselves, the picture reverses:
| Same communities, compared with themselves | Against Sep 2025 to Feb 2026 | Against the same months of 2025 | Communities and sales covered |
|---|---|---|---|
| Off-plan apartments | +2.9% | +6.3% | 63 communities, 31,206 sales |
| Off-plan villas | −1.4% | −4.2% | 12 communities, 1,273 sales (small sample) |
| Ready apartments | −2.6% | +1.8% | 49 communities, 9,776 sales |
| Ready villas | −2.5% | +1.2% | 21 communities, 1,296 sales |
Off-plan villas are the one segment that is slightly lower like-for-like (−1.4% and −4.2%), and the sample is small: 12 communities. Their raw median swings with the mix of projects. It was AED 1,980/sqft (AED 21,313/m²) in December 2025 and AED 1,640/sqft (AED 17,653/m²) since June, and the raw +12.8% on last year comes from the same mix effect, not from price rises. We treat the like-for-like figures as the real signal.
That is the core of our view: the price of a given home has moved by a few percent, while volumes moved a lot.
| Registered sales | Mar to May 2026 | vs 2025 | Jun to early Oct 2026 | vs 2025 |
|---|---|---|---|---|
| Ready apartments | 6,222 | −45% | 10,111 | −28% |
| Ready villas | 1,099 | −44% | 1,804 | −30% |
| Off-plan apartments | 23,477 | −11% | 32,024 | −35% |
| Off-plan villas | 1,971 | −11% | 1,594 | −19% |
Ready sales hit their low in May (1,776 ready apartment sales) and have risen to 2,345 in September, a gain of 32%. Off-plan sales slowed later, because fewer projects were launched (more on that below).
Other indices read the same direction. ValuStrat's August 2026 index was 3.1% below a year earlier, with apartments down 5.3% and villas down 1.7% (its first annual fall for villas since 2021). Property Monitor's city median stood at AED 1,632/sqft (AED 17,567/m²) in August, 3.0% under its peak of AED 1,683. Cavendish Maxwell recorded AED 1,636/sqft (AED 17,610/m²), down 1.7% on the year, its first annual decline since February 2021. ValuStrat also shows its index 10.2% below its February level, a deeper move than registered sales, because valuation indices and registered deals measure different things. At the other end, Knight Frank's prime index had Dubai luxury prices up 10.9% in the year to June, third among world cities.
Supply in the most popular areas
New homes decide how much room prices have. The official project register lists 246 projects (63,364 homes) due in 2026, on average 54% built, then 414 projects (113,679 homes) due in 2027 and 377 (113,141) due in 2028. For comparison, Dubai completed between 32,500 and 48,200 homes a year in 2022 to 2025, and 15,958 so far in 2026. The register's own dates imply about 79,000 homes in 2026 (15,958 done plus 63,364 still due); Cushman & Wakefield's forecast is about 55,600, the most since 2008. The gap suggests close to 30% of this year's planned homes will arrive in 2027.
The pipeline is not spread evenly:
| Area | Homes in pipeline | Due 2026 and 2027 | Ready AED/sqft, Sep 2025 to Feb 2026 | Ready AED/sqft, Mar to early Oct 2026 | vs same months 2025 |
|---|---|---|---|---|---|
| Palm Jumeirah | 2,550 | 1,682 | 2,717 | 2,513 | −0.7% |
| Downtown Dubai | 4,582 | 4,383 | 2,594 | 2,420 | −4.3% |
| Dubai Marina | 3,841 | 2,048 | 1,869 | 1,883 | +7.1% |
| Dubai Hills Estate | 8,776 | 549 | 2,363 | 2,229 | −0.8% |
| Dubai Creek Harbour | 7,382 | 908 | 2,364 | 2,290 | +0.7% |
| Business Bay | 23,516 | 14,308 | 1,877 | 1,823 | +3.4% |
| Jumeirah Village Circle | 34,236 | 15,718 | 1,341 | 1,252 | −0.4% |
Read the table by supply. Palm Jumeirah, Downtown, Marina and Dubai Hills have light 2026 and 2027 pipelines (Dubai Hills' big wave of about 7,100 homes arrives in 2028 and 2029). Palm Jumeirah and Dubai Hills are within 1% of a year ago and Marina is up 7.1%; Downtown is the exception at −4.3%. Business Bay and Jumeirah Village Circle carry about 14,000 to 16,000 homes each across 2026 and 2027, and JVC's pipeline equals a third of its existing stock. Their ready prices are flat to slightly up on a year ago, but the weight of 2027 deliveries is the main reason we expect those two areas to lag our citywide +2% for ready apartments. Apartment-heavy districts feel new supply first; villa communities feel it last.
New areas: where buyers moved
Since March the off-plan market has moved to newer master communities, mostly in the south and west of the city:
| New area | Homes in pipeline | Off-plan apartment sales since March | Typical off-plan AED/sqft | vs same months 2025 |
|---|---|---|---|---|
| Dubai South (Dubai World Central) | 32,916 | 8,824 | 1,717 | +5.1% |
| Dubai Land Residence Complex | 21,479 | 3,122 | 1,456 | +2.2% |
| Palm Deira | 14,498 | 2,102 | 2,834 | +18.3% |
| Majan | 12,953 | 2,582 | 1,444 | +3.1% |
| Dubai Maritime City | 12,252 | 762 | 3,215 | +7.1% |
| City of Arabia | 10,434 | 2,400 | 1,708 | +11.3% |
| DAMAC Lagoons | 7,305 | 1,695 | 1,831 | +5.5% |
| Dubai South Residential District | 7,359 | 1,399 | 1,460 | +16.6% |
These eight areas hold about 119,000 homes in the pipeline and took roughly 22,900 of the off-plan apartment sales since March. All eight are priced higher than a year ago. The established off-plan markets did the opposite: Business Bay is 3.9% lower and Dubai Hills 2.7% lower. Six of the eight sell at AED 1,450 to 1,850/sqft, against AED 2,400 to 3,800 for off-plan in Business Bay, Dubai Hills and Downtown. A caution: later phases of a project usually launch at higher prices than the first phase, so part of that rise is the project moving up, not the area. The long-term test for each new area is the same: roads, metro or rail, schools and a resident community. Buyers should check what is delivered, not only what is promised.
Launches since March
The official project register shows 166 new projects, with 51,075 homes, registered between 1 March and 12 October 2026. In the same months of 2025 it was 405 projects with 107,684 homes. That is 59% fewer projects and 53% fewer homes. In the eight months before the conflict developers registered about 53 projects a month. Since March the average is about 23 a month, with a low of 11 in May and a steady 21 to 25 a month from June.
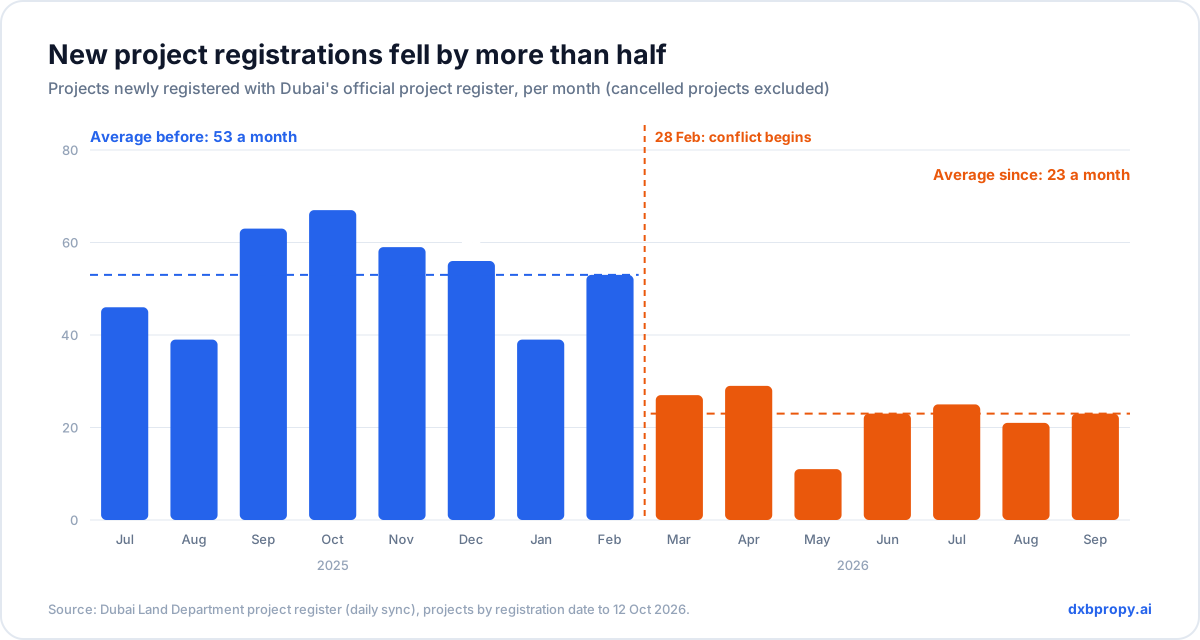
Our launch calendar shows the same pattern: 23 dated launches in March, 23 in April and 8 in August. Two consequences follow. In the short run, fewer launches means fewer off-plan sales (September off-plan apartment sales were 6,295 against 13,477 a year earlier). In the long run, fewer projects registered in 2026 means fewer homes handed over in 2029 and 2030. The wave arriving in 2027 and 2028 was launched in the boom. The wave that follows will be smaller. This is the main reason we think the next real up-leg is more likely in 2028 than in 2027.
Building costs and inflation: why new projects will cost more
The Dubai Statistics Center's construction cost index for residential buildings reached 120.6 in the second quarter of 2026, the highest reading in its series (2013 onwards). It rose 5.9% in one quarter and 10.8% in one year. From the first quarter of 2024 to the first quarter of 2026 it had risen only about 6% in total.
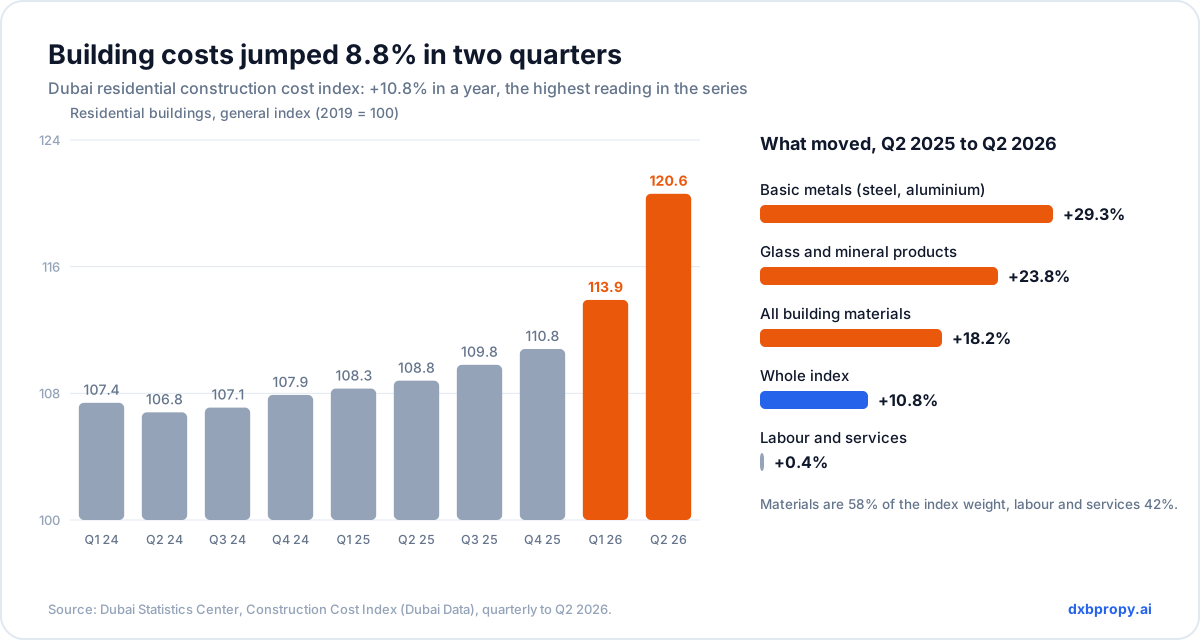
The jump is in materials, not people. Materials (58% of the index) are up 18.2% in a year. Basic metals (steel, aluminium) are up 29.3%, and glass and mineral products 23.8%. Fuel and refined oil products are up 80%, which lifts transport and asphalt costs, though they weigh little in the index. Labour and services (42% of the index) are up 0.4%. That points to imported materials and shipping, not to wages.
What it means for new launches, as simple arithmetic: if construction is about 40% of a developer's all-in cost (an assumption, not our measurement), a 10.8% rise in building costs lifts the price needed to keep the same margin by about 4%. Land, finance and marketing costs sit on top. Developers who sell at fixed prices today absorb part of it; developers launching next year will not. This is why we expect off-plan prices in the same community to rise in 2027 (+5% base case), even if the typical ready price barely moves.
Consumer inflation adds to the same argument. Dubai's consumer price index was 107.7 in May 2026, up 5.5% on a year earlier (it was 104.8 in February). A ready home that is flat in AED is down about 5% in real terms over the same year. It also raises the cost of replacing existing homes, which supports values over time.
How past shocks recovered, and how long it took
Dubai has been here before. Property Monitor's long city price series, together with our own DLD price index, gives the record:
| Episode | What caused it | Fall | How long to recover |
|---|---|---|---|
| 2008 to 2012 global financial crisis | Credit froze; speculative off-plan | −30% on the median price per sq ft (Sep 2008 AED 1,211 to Sep 2012 AED 853); deeper on some value indices | 2008 level passed in 2014: about 5 to 6 years from the peak, about 2 years from the low |
| 2014 to 2020 oil and supply correction | Oil, strong dollar, heavy supply | −35% (Sep 2014 AED 1,234 to Aug 2020 AED 807, with COVID in the last year) | Our DLD index: peak May 2015, low June 2021 (−18%), peak regained June 2022. Property Monitor's median passed 2014 in 2023 |
| 2020 COVID (inside the long correction above) | Lockdowns | −10% (Sep 2019 AED 915 to Sep 2020 AED 823) | Above the pre-COVID level by Sep 2021, about a year after the low |
| 2024 floods | Record rain | Local, in low-lying communities | Quick at city level; the effect stayed local |
| 2026 conflict | Regional war | −3% to −10% depending on the index; registered sales −11% to −45% depending on segment and period | Buyer interest back in about 7 weeks; ready sales rising since May; prices not yet back at the February level |
The lesson: shocks caused by demand heal in about a year; shocks caused by supply take years. 2026 is a mix of both: a demand shock on top of a record handover wave. That is why we expect a slow, grinding recovery, not a V-shape. On our base case, ready villas regain their pre-conflict level (AED 1,497/sqft (AED 16,114/m²)) around the third quarter of 2027, and ready apartments come within 1% of theirs (AED 1,468/sqft (AED 15,801/m²)) by the end of 2027. Our market cycles page and outlook page show the same history in charts.
Confidence: people still believe in Dubai
Confidence is hard to measure, so we use two kinds of evidence: what people say and what they do.
What people say. Provident Estate's UAE Real Estate Market Sentiment Report 2026 (survey run 15 April to 7 May, more than 90 countries) gave Dubai a perception score of 4.01 out of 5. 64% of respondents were positive, 67.5% were looking, preparing or waiting to buy, 43.8% planned to buy within 6 to 12 months, and 46.8% said global uncertainty had increased their confidence in the UAE. Morgan's International Realty surveyed 94 investors holding more than AED 3 billion of Dubai property in April and May: 58% still see Dubai as a safe haven for capital, 29% are neutral and 13% disagree. Over three years 60% expect prices to rise and only 9% expect a decline; over 12 months the view is cautious (46% expect stability, 18% a rise, 36% a decline). The larger the portfolio, the calmer the view: among holders of AED 100 million or more, none plan to sell. These are private surveys with small samples, so read them as direction, not as a measurement.
What people do. Between 1 March and 30 September 2026, buyers registered 76,055 apartment and villa sales worth AED 156.4 billion with the Dubai Land Department, and January to September 2026 had 114,583 residential sales in Property Monitor's count: only 2024 and 2025 were busier. Buyers who bought after the conflict began paid more for the same communities off-plan (+2.9%). Dubai's population grew by about 332,000 people in 2025 to 4.58 million (+7.8%), and Dubai's GDP grew 9.2% to AED 971.7 billion.
The honest reading: confidence is conditional, not gone. Investors are choosing more carefully, holding cash for the right entry, and judging Dubai on supply, developer quality and delivery. Short-term caution with long-term conviction is how a market behaves when it expects to stay.
Where we see the market going in 2027
2027 is the year the market digests supply. Our base case, with the indicators behind each part:
- Ready apartments: flat to slightly up (+2%, AED 1,459/sqft (AED 15,705/m²)). About 113,700 homes are dated for 2027, and population growth of 7.8% a year gives them buyers and tenants, but not enough to lift prices fast. Areas with the heaviest deliveries (JVC, Business Bay, Dubai South) stay soft.
- Ready villas: a firmer +4% (AED 1,518/sqft (AED 16,340/m²)). Few new villas arrive in the established communities, and the villa buyer is mostly an end user.
- Off-plan villas: +3% in the same community (AED 1,700/sqft (AED 18,299/m²)). Costs push launch prices up, but this is the segment with the weakest like-for-like trend so far and a lot of villa supply in cheaper areas, so we expect less than for apartments. The bear case is −6%.
- Off-plan apartments: +5% in the same community. Costs are up 10.8% and 59% fewer projects were registered. Expect smaller launches and higher prices per sq ft. The median can look flat if buyers keep moving to cheaper frontier areas.
- Rents: roughly flat. New supply keeps pressure on new leases (CBRE recorded average rents 2.6% lower on the year in Q2 2026), while the official rental index is still up 5.6% on the year because renewals adjust slowly.
- 2028 onwards: the smaller launch years of 2026 and 2027 mean a thinner handover wave in 2029 and 2030. That is the set-up for the next growth phase.
Six indicators we will watch, and what would change our view:
- Ready apartment sales per month. Above 3,000 means demand is back (September 2026: 2,345; the monthly average in March to September 2025 was about 3,500). Below 2,000 again would move weight to the bear case.
- New project registrations. A return above 35 a month would signal developers are confident again, and add to supply in 2029 and later.
- Real handovers against plan. If more than 55,000 homes are handed over in 2026, supply pressure in 2027 is higher than we assume.
- The construction cost index for Q3 and Q4 2026. A second jump pushes launch prices up further; a flat reading eases the +5% off-plan case.
- Consumer inflation. If it falls back below 3%, real prices stop eroding.
- Same-community ready prices. If ready apartments stay within 3% of AED 1,407/sqft (AED 15,145/m²) through the year-end season, our December forecast holds. A move below AED 1,380/sqft (AED 14,854/m²) is the bear signal.
How we made the forecast
We used official Dubai Land Department records plus 200 million+ market datapoints, growing daily. The registered sales are cleaned (genuine sales only, prices between AED 50 and 25,000 per sq ft, ready and off-plan kept apart), then compared period by period and community by community. The December level starts from the June to early October median, then adds a seasonal lift for the year-end quarter of about 1.5% for apartments and 1% for villas, estimated from the third-to-fourth-quarter pattern of 2022 to 2025 net of each year's trend. Ranges come from the month-to-month spread of the last 12 months (about ±3.5% for ready homes). The 2027 cases combine the supply pipeline, the cost index, inflation and the recovery times in the table above, and they match the base, bull and bear cases on our outlook page. Off-plan medians move with the mix of projects sold, which is why we also compare community by community. A forecast is a reasoned estimate, not a promise.
The dxbpropy take
The headlines say the market fell. The registry says a typical home costs 3 to 4% less than before the conflict, buyers are still buying, and the cost of building a new one has just gone up by a tenth. Those three facts together describe a market that is pausing, not breaking, and that will reward buyers who choose by community, supply and delivery rather than by headline.
Want the numbers for your area, building or budget? Ask dxbpropy.ai for the typical price, supply pipeline and past trend of any Dubai community, ready or off-plan, in AED per sq ft and per m².
Sources: dxbpropy.ai analysis of Dubai Land Department registered sales to 7 October 2026 (apartments and villas, ready and off-plan kept apart; medians of AED per sq ft) and of the Dubai Land Department project register (daily sync, to 13 October 2026); Dubai Statistics Center, Construction Cost Index (Q2 2026) and Consumer Price Index (May 2026); Dubai Statistics Center, population and GDP (2025); Property Monitor, Dubai City Index and September 2026 market statistics; ValuStrat, August 2026 Residential Price Index; Cavendish Maxwell, August 2026; Knight Frank Prime Global Cities Index, June 2026; CBRE, Q2 2026 residential review; Cushman & Wakefield, July 2026 supply forecast; Provident Estate, UAE Real Estate Market Sentiment Report 2026; Morgan's International Realty, Dubai Property Investor Confidence Report 2026; Arab News, conflict timeline, September 2026. Forecasts are our own reasoned estimates, not guarantees, and the figures are indicative market intelligence, not financial advice.